FIBONACCI ANALYSIS AND ELLIOTT WAVE THEORY
Elliott Wave Theory (EWT)
Ralph Nelson Elliott referred to three important aspects of price movement in his theory: pattern, ratio and time. Pattern refers to the wave patterns or formations, while ratio (the relationship between numbers, particularly the Fibonacci series) is useful for measuring waves. To use the theory in everyday trading, the trader determines the main wave, or supercycle, goes long and then sells or shorts the position as the pattern runs out of steam and a reversal is imminent.
-
The Five-Wave Pattern
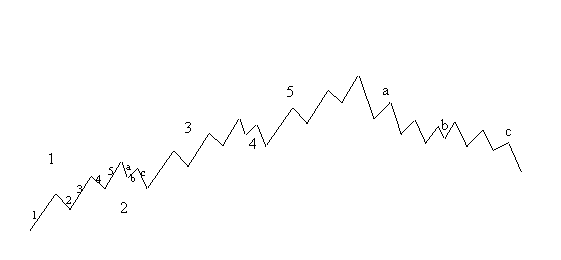
In its most basic form the Elliott Wave Theory states that all market action follow a repetitive rhythm of a five waves in the directions of the main trend followed by three corrective waves (a "5-3" move).
The advance waves are denoted 1-2-3-4-5 and the retreat waves are denoted a-b-c. In the advance waves' phase, waves 1, 3, and 5 are "impulse waves" and move in the direction of the trend, while waves 2 and 4 are called "corrective waves". After the five-wave advance is completed, a three-wave correction begins denoted a-b-c. In the correction waves' phase, waves 'a' and 'c' move in the direction of the retreat, while wave 'b' heads in the opposite direction.
-
Note: In the chart shown here an uptrend is described and therefore the advance waves are moving upwards. In a downtrend the descending waves will be referred to in the form 1-2-3-4-5, with the ascending waves addressed as a-b-c.
-
Wave cycles
When a three-wave retreat is complete, another five-wave advance begins and so on, until a reversal is prompted. It is possible to see then, that each five-wave advance can be identified as a single advance wave. Similarly, when viewed from a larger perspective, and vice versa, each wave can be broken down into smaller waves.
The Elliott Wave Theory classifies waves according to cycle length, ranging from a Grand Supercycle, spanning for decades; to a subminuette degree, covering no more than a few hours. However, the eight-wave cycle remains constant.
-
Note: The largest two waves, 1 and 2 here, can be subdivided into eight lesser waves that in turn can be subdivided into 34 even lesser waves. The two largest waves, 1 and 2, are only the first two waves in a larger five-wave advance. Wave 3 of that next higher degree is about to begin. The 34 waves that constitute a cycle can be broken down further to the next smallest degree which would result in 144 waves.
Fibonacci Analysis
Fibonacci numbers provide the mathematical foundation for the Elliott Wave Theory. While the Fibonacci ratios have been adapted to various technical indicators, their utmost use in technical analysis remains the measurement of correction waves.
-
Fibonacci Series Characteristics
The Fibonacci number sequence is made by simply starting at 1 and adding the previous number to arrive at the new number:
0+1=1, 1+1=2, 2+1=3, 3+2=5, 5+3=8, 8+5=13, 13+8=21, 21+13=34, 34+21=55, 55+34=89,…
This series has very numerous interesting properties:
+ The ratio of any number to the next number in the series approaches 0.618 or 61.8% (the golden ratio) after the first 4 numbers. For example: 34/55 = 0.618
+ The ratio of any number to the number that is found two places to the right approaches 0.382 or 38.2%. For example: 34/89 = 0.382
+ The ratio of any number to the number that is found three places to the right approaches 0.236 or 23.6%. For example: 21/89 = 0.236
These relationships between every number in the series are the foundation of the common ratios used to determine price retracements and price extensions during a trend.
Fibonacci Price Retracements
A retracement is a move in price that "retraces" a portion of the previous move. Usually a stock will retrace at one of 3 common Fibonacci levels - 38.2%, 50%, and 61.8%. Fibonacci price retracements are determined from a prior low-to high swing to identify possible support levels as the market pulls back from a high.
Retracements are also run from a prior high-to-low swing using the same ratios, looking for possible resistance levels as the market bounces from a low.
-
Fibonacci Price Extensions
Fibonacci price extensions are used by traders to determine areas where they will wish to take profits in the next leg of an up-or downtrend. Percentage extension levels are plotted as horizontal lines above/below the previous trend move. The most popular extension levels are 61.8%, 100.0%, 138.2% and 161.8%.
-
Advice
In reality it is not always so easy to spot the correct Elliott wave pattern, nor do prices always behave exactly according to this pattern. Therefore it is advisable for a trader not to rely solely on Fibonacci ratios, but rather to use them in conjunction with other technical tools.